New Space Station Crew Launches; In-Orbit News Conference Set

The next residents of the International Space Station launched into orbit aboard a Soyuz spacecraft Wednesday from the Baikonur Cosmodrome in Kazakhstan. NASA astronaut Jeff Williams, Russian cosmonaut Max Suraev and spaceflight participant Guy Laliberte lifted off at 2:14 a.m. CDT.

Future Expedition 22 Commander Williams, Soyuz Commander Suraev and Laliberte are scheduled to dock with the station at 3:37 a.m., Friday, Oct. 2. They will spend nine days as members of a joint crew that includes Expedition 20 Commander Gennady Padalka, NASA's Mike Barratt and Nicole Stott, the European Space Agency's Frank De Winne, Russian cosmonaut Roman Romanenko and the Canadian Space Agency's Bob Thirsk.

The nine spacefarers will answer questions from reporters during a news conference from the complex at 9:10 a.m. Oct. 6. The 30-minute news conference will be divided for U.S. journalists at NASA centers, Canadian media representatives at the Canadian Space Agency's headquarters in Quebec and European reporters.

On Oct. 10, Padalka will transfer command of the station to De Winne, who will become commander of the next station mission, designated Expedition 21. Padalka, Barratt and Laliberte will land in Kazakhstan at about 11:29 p.m. Padalka and Barratt have been aboard the orbiting laboratory since March 2009.

Laliberte, a Canadian citizen and the founder of Cirque du Soleil, is flying to the station under an agreement between the Russian Federal Space Agency and Space Adventures, Ltd. He will spend nine days aboard the orbiting laboratory.

Heavy Rains in Philippines


On September 26, 2009, in a matter of hours, Tropical Storm Ketsana dropped a month’s worth of rain on the Philippine capital of Manila. Streets resembled rivers, covered by water that was chest high and still rising, according to news reports. Over the next few days, death tolls climbed from dozens to over 200, with more casualties expected and search and rescue efforts continued. As of September 28, more than 100,000 people had taken refuge in evacuation centers, and more than 330,000 were believed to be affected.

The estimates, acquired by multiple satellites, are calibrated with rainfall measurements from the Tropical Rainfall Measuring Mission (TRMM) satellite in the Multi-satellite Precipitation Analysis. The highest rainfall amounts—more than 600 millimeters (23.6 inches)—appear in blue. The lightest amounts appear in pale green. Gray shading indicates island topography of the Philippines.

Rainfall occurs over the entire region shown in this image. The heaviest pocket of rain appears off the west coast of southern Luzon, over the South China Sea. A large expanse of heavy rain stretches from that locality across southern Luzon. An area of heavy rain also occurs immediately south of the capital city.

The flooding that struck the region in late September 2009 was the worst in more than 40 years. Officials declared a “state of calamity” in Manila and 25 provinces affected by the storm.

Ash and Steam Plume from Chaitén


After a spectacular explosion in May of 2008, Chile’s Chaitén volcano has erupted continuously for the past 16 months. The arrival of spring in the Southern Hemisphere allowed this clear view of the ongoing eruption, which had been hidden by clouds for much of the winter. Chaitén is currently in a dome building phase. Thick lava is erupting in Chaitén’s caldera, slowly building a steep-sided dome. Eruptions of ash and steam occur when portions of the dome collapse. The town of Chaitén (located south of the volcano) remains evacuated due to the threat of flows of volcanic debris from the unstable dome.

The Advanced Land Imager (ALI) aboard the NASA/USGS Earth Observing-1 (EO-1) satellite acquired this natural color image of Chaitén on September 27, 2009, at roughly 10:30 am local time. The U.S. Air Force Weather Agency reported an ash plume extending 56 km (35 miles) northwest of the summit at the time the image was taken.

Cosmic Rays Hit Space Age High


Planning a trip to Mars? Take plenty of shielding. According to sensors on NASA's ACE (Advanced Composition Explorer) spacecraft, galactic cosmic rays have just hit a Space Age high.

"In 2009, cosmic ray intensities have increased 19% beyond anything we've seen in the past 50 years," says Richard Mewaldt of Caltech. "The increase is significant, and it could mean we need to re-think how much radiation shielding astronauts take with them on deep-space missions."

The cause of the surge is solar minimum, a deep lull in solar activity that began around 2007 and continues today. Researchers have long known that cosmic rays go up when solar activity goes down. Right now solar activity is as weak as it has been in modern times, setting the stage for what Mewaldt calls "a perfect storm of cosmic rays."

"We're experiencing the deepest solar minimum in nearly a century," says Dean Pesnell of the Goddard Space Flight Center, "so it is no surprise that cosmic rays are at record levels for the Space Age."

Galactic cosmic rays come from outside the solar system. They are subatomic particles--mainly protons but also some heavy nuclei--accelerated to almost light speed by distant supernova explosions. Cosmic rays cause "air showers" of secondary particles when they hit Earth's atmosphere; they pose a health hazard to astronauts; and a single cosmic ray can disable a satellite if it hits an unlucky integrated circuit.

The sun's magnetic field is our first line of defense against these highly-charged, energetic particles. The entire solar system from Mercury to Pluto and beyond is surrounded by a bubble of solar magnetism called "the heliosphere." It springs from the sun's inner magnetic dynamo and is inflated to gargantuan proportions by the solar wind. When a cosmic ray tries to enter the solar system, it must fight through the heliosphere's outer layers; and if it makes it inside, there is a thicket of magnetic fields waiting to scatter and deflect the intruder.

"At times of low solar activity, this natural shielding is weakened, and more cosmic rays are able to reach the inner solar system," explains Pesnell.

Mewaldt lists three aspects of the current solar minimum that are combining to create the perfect storm:
  1. The sun's magnetic field is weak. "There has been a sharp decline in the sun's interplanetary magnetic field (IMF) down to only 4 nanoTesla (nT) from typical values of 6 to 8 nT," he says. "This record-low IMF undoubtedly contributes to the record-high cosmic ray fluxes."
  2. The solar wind is flagging. "Measurements by the Ulysses spacecraft show that solar wind pressure is at a 50-year low," he continues, "so the magnetic bubble that protects the solar system is not being inflated as much as usual." A smaller bubble gives cosmic rays a shorter-shot into the solar system. Once a cosmic ray enters the solar system, it must "swim upstream" against the solar wind. Solar wind speeds have dropped to very low levels in 2008 and 2009, making it easier than usual for a cosmic ray to proceed.
  3. The current sheet is flattening. Imagine the sun wearing a ballerina's skirt as wide as the entire solar system with an electrical current flowing along the wavy folds. That is the "heliospheric current sheet," a vast transition zone where the polarity of the sun's magnetic field changes from plus (north) to minus (south). The current sheet is important because cosmic rays tend to be guided by its folds. Lately, the current sheet has been flattening itself out, allowing cosmic rays more direct access to the inner solar system.

"If the flattening continues as it has in previous solar minima, we could see cosmic ray fluxes jump all the way to 30% above previous Space Age highs," predicts Mewaldt.

Earth is in no great peril from the extra cosmic rays. The planet's atmosphere and magnetic field combine to form a formidable shield against space radiation, protecting humans on the surface. Indeed, we've weathered storms much worse than this. Hundreds of years ago, cosmic ray fluxes were at least 200% higher than they are now. Researchers know this because when cosmic rays hit the atmosphere, they produce an isotope of beryllium, 10Be, which is preserved in polar ice. By examining ice cores, it is possible to estimate cosmic ray fluxes more than a thousand years into the past. Even with the recent surge, cosmic rays today are much weaker than they have been at times in the past millennium.

"The space era has so far experienced a time of relatively low cosmic ray activity," says Mewaldt. "We may now be returning to levels typical of past centuries."

Expedition 21 Crew Launches From Kazakhstan

The Soyuz TMA-16 rocket
Flight Engineers Jeffrey Williams and Maxim Suraev of the 21st International Space Station crew launched in their Soyuz TMA-16 spacecraft from the Baikonur Cosmodrome in Kazakhstan at 3:14 a.m. EDT Wednesday to begin a six-month stay in space.

Less than 10 minutes after launch their spacecraft reached orbit, and its antennas and solar arrays were deployed shortly afterward.

With Williams, a retired U.S. Army colonel, and Suraev, a colonel in the Russian Air Force, is spaceflight participant Guy Laliberté, flying under an agreement between the Russian Federal Space Agency and Space Adventures, Ltd.

Laliberté will depart the station with Expedition 20 crew members Commander Gennady Padalka and Flight Engineer Michael Barratt in their Soyuz TMA-14 on Oct. 10. Padalka and Barratt launched to the station on March 26.

The Expedition 21 crew members will be welcomed by the Expedition 20 crew, including Flight Engineers Nicole Stott, Roman Romanenko, Robert Thirsk and Frank De Winne, who will transition to the Expedition 21 crew with the departure of Padalka and Barratt. With the inauguration of Expedition 21, De Winne of the European Space Agency will become the first European commander of the orbiting complex.

Williams, 51, is making his third trip to the space station. His first flight was aboard space shuttle Atlantis on the STS-101 mission, which delivered and installed over 5,000 pounds of equipment and supplies to the station in May 2000. In 2006, Williams served a six-month tour of duty aboard the station as an Expedition 13 flight engineer and science officer. Williams has logged over 193 days in space, including over 19 hours in three spacewalks.

Suraev, 37, is making his first flight into space. He is a graduate of the Kachin Air Force Pilot School and the Zhukovski Air Force Academy and received a law degree from the Russian Academy of Civil Service. Qualified as a test-cosmonaut in November 1999, Suraev served as a backup crew member for Expeditions 17 and 19.

NASA Publishes Report about International Space Station Science

Advances in the fight against food poisoning, new methods for delivering medicine to cancer cells, and better materials for future spacecraft are among the results published in a NASA report detailing scientific research accomplishments made aboard the International Space Station during its first eight years.

The report includes more than 100 science experiments ranging from bone studies to materials research.

NASA's LCROSS Mission Changes Impact Crater

NASA's Lunar Crater Observation and Sensing Satellite mission (LCROSS) based on new analysis of available lunar data, has shifted the target crater from Cabeus A to Cabeus (proper).

The decision was based on continued evaluation of all available data and consultation/input from members of the LCROSS Science Team and the scientific community, including impact experts, ground and space based observers, and observations from Lunar Reconnaissance Orbiter (LRO), Lunar Prospector (LP), Chandrayaan-1 and JAXA's Kaguya spacecraft. This decision was prompted by the current best understanding of hydrogen concentrations in the Cabeus region, including cross-correlation between the latest LRO results and LP data sets.

The general consensus of lunar experts led by the LCROSS science team is that Cabeus shows, with the greatest level of certainty, the highest hydrogen concentrations at the south pole. Further consideration of the most current terrain models provided by JAXA's Kaguya spacecraft and the LRO Lunar Orbiter Laser Altimeter (LOLA) was important in the decision process.The models show a small valley in an otherwise tall Cabeus perimeter ridge, which will allow for sunlight to illuminate the ejecta cloud on Oct. 9, and much sooner than previously estimated for Cabeus. While the ejecta does have to fly to higher elevations to be observed by Earth assets, a shadow cast by a large hill along the Cabeus ridge, provides an excellent, high-contrast, back drop for ejecta and vapor measurements.

The LCROSS team concluded that Cabeus provided the best chance for meeting its mission goals. The team critically assessed and successfully advocated for the change with the Lunar Precursor Robotic Program (LPRP) office. The change in impact crater was factored into LCROSS' most recent Trajectory Correction Maneuver, TCM7.

During the last days of the mission, the LCROSS team will continue to refine the exact point of impact within Cabeus crater to avoid rough spots, and to maximize solar illumination of the debris plume and Earth observations.

Light-Duty Day for Crew, Expedition 21 Prepares for Launch

 Expedition 21 Prepares for Launch
The Expedition 20 crew members had a light-duty work day and performed a variety of maintenance and science-related tasks Monday as they prepare for a busy week aboard the International Space Station.

Flight Engineer Frank De Winne installed cables to prepare for the set up of the new Combined Operational Load Bearing External Resistance Treadmill (COLBERT) that arrived aboard space shuttle Discovery during STS-128.

The crew members unpacked many of the COLBERT treadmill’s components and started the lengthy assembly process. They will be occupied with the assembly and outfitting of the treadmill in the Harmony node throughout the week.

The Canadian-built Special Purpose Dexterous Manipulator (DEXTRE) had its first significant workout today. It will be commanded to perform various manipulative tasks over the next three days in advance of maintenance work on a remote power control module component scheduled for next year.

Commander Gennady Padalka and Flight Engineer Michael Barratt reviewed Soyuz descent procedures as they move into the final two weeks of their half year aboard the station. They are scheduled to leave in the Soyuz TMA-14 spacecraft the night of Oct. 10 and land in Kazakhstan early the next day.

Meanwhile, the Expedition 21 crew, Flight Engineers Maxim Suraev and Jeffrey Williams, and spaceflight participant Guy Laliberte prepared for Wednesday’s 3:14 a.m. EDT launch to the station from the Baikonur Cosmodrome in Kazakhstan. They are scheduled to arrive and dock to the station on Friday.

The Soyuz TMA-16 spacecraft was transported from its assembly building at the Baikonur Cosmodrome on Monday to the Site 254 launch pad and rotated from its horizontal position on its railcar to its vertical position on the pad.

The ISS Progress 34 cargo craft, filled with trash, was deorbited Sunday at 5:33 a.m. and burned up in the Earth’s atmosphere over the Pacific. It undocked automatically from the station last week.

In-Line Water Filtration: Better Hygeine, Less Expense

The DentaPure waterline purification cartridge
Water space Shuttle
Water, essential to sustaining life on Earth, is that much more highly prized in the unforgiving realm of space travel and habitation. Given a launch cost of $10,000 per pound for space shuttle cargo, however, each gallon of water at 8.33 pounds quickly makes Chanel No. 5 a bargain at $25,000 per gallon. Likewise, ample water reserves for drinking, food preparation, and bathing would take up an inordinate amount of storage space and infrastructure, which is always at a premium on a vessel or station.

Water rationing and recycling are an essential part of daily life and operations on the space shuttles and International Space Station. In orbit, where Earth's natural life support system is missing, the International Space Station has to provide abundant power, clean water, and breathable air at the right temperature and humidity for the duration of human habitation and with virtually no waste. The Environmental Control and Life Support System (ECLSS), under continuing development at the Marshall Space Flight Center, helps astronauts use and reuse their precious supplies of water. Future work will explore air management, thermal control, and fire suppression -- in short, all of the things that will make human habitation in space comfortable and safe.

The ECLSS Water Recycling System (WRS) reclaims wastewaters from humans and lab animals in the form of breath condensate, urine, hygiene and washing, and other wastewater streams. On Earth, biological wastewater is physically filtered by granular soil and purified as microbes in the soil break down urea, converting it to a form that plants can absorb and use to build new tissue. Wastewater also evaporates and returns as fresh rain water -- a natural form of distillation. WRS water purification machines on the ISS mimic these processes, though without microbes or the scale of these processes.

A NASA industry partner, Umpqua Research Company, of Myrtle Creek, Oregon, supplier of the bacterial filters used in the life support backpacks worn by space-walking astronauts, helped develop air and water purification technologies for human missions in space. To prevent back-contamination of a drinking water supply by microorganisms, Umpqua developed the microbial check valve, consisting of a flow-through cartridge containing iodinated ion exchange resin. In addition to the microbial contact kill, the resin was found to impart a biocidal residual elemental iodine concentration to the water.

Umpqua's valve and resin system was adopted by NASA as the preferred means of disinfecting drinking water aboard U.S. spacecraft, and canisters are now used on space shuttle missions, the ISS, and for ground-based testing of closed life support technology. Iodine was selected by NASA as the disinfectant of choice because of its lower vapor pressure and reduced propensity for formation of disinfection byproducts compared to chlorine or bromine.

MRLB International Inc., of Fergus Falls, Minnesota, used Umpqua's water purification technology in the design of the DentaPure waterline purification cartridge (Spinoff 1998). It was designed to clean and decontaminate water as a link between filter and high-speed dental tools and other instruments, and offers easy installation on all modern dental unit waterlines with weekly replacement cycles. The product, like its NASA forebear, furnished disinfected water and maintained water purity even with "suckback," an effect caused by imperfect anti-retraction valves in dental instruments, which draws blood, saliva, and other materials from a patient's mouth into the waterline.

Various models of DentaPure now address a variety of needs, and are used in dental offices and schools across the country. The technology offers remarkable filtration: registered to provide 200 CFU/ml purity (Colony Forming Unit/milliliter, a standard measure of microbial concentration) -- the Centers for Disease Control and Prevention (CDC) standard is 500 CFU, and untreated lines can harbor in excess of 1,000,000 CFU/ml.

Better filtration, greater capacity, and longer service intervals have also led to great savings -- the University of Maryland Dental School estimates it saves $274,000 per year courtesy of DentaPure. The DentaPure system has proven so effective that 40 percent of dental schools nationwide employ it.

The investment in water filtration for space missions continues to pay huge dividends to users and society, year after year, in technologies so woven into our lives that we use them without even thinking about them.

Floundering El Niños Make for Fickle Forecasts


Since May 2009, the tropical Pacific Ocean has switched from a cool pattern of ocean circulation known as La Niña to her warmer sibling, El Niño. This cyclical warming of the ocean waters in the central and eastern tropical Pacific generally occurs every three to seven years, and is linked with changes in the strength of the trade winds. El Niño can affect weather worldwide, including the Atlantic hurricane season, Asian monsoon season and northern hemisphere winter storm season. But while scientists agree that El Niño is back, there's less consensus about its future strength.

One of the characteristics that signal a developing El Niño is a change in average sea surface height compared to normal sea level. The NASA/French Space Agency Jason-1 and Ocean Surface Topography Mission/Jason-2 satellites continuously observe these changes in average sea surface height, producing near-global maps of the ocean's surface topography every 10 days.

Recent data on sea-level height from the Jason-1 and Ocean Surface Topography Mission/Jason-2 satellites, displayed at http://sealevel.jpl.nasa.gov/science/jason1-quick-look/ , show that most of the equatorial Pacific is near normal (depicted in the images as green). The exceptions are the central and eastern equatorial Pacific, which are exhibiting areas of higher-than-normal sea surface heights (warmer-than-normal sea-surface temperatures) at 180 and 110 degrees west longitude.

The latest image from Jason-2, which can be seen at http://sealevel.jpl.nasa.gov/science/jason1-quick-look/2009/images/20090917P.jpg, reflects a 10-day data cycle centered around September 17, 2009. It shows a series of warm "bumps" visible along the equator, denoted in the image by a black line. Known as Kelvin waves, these pools of warm water were triggered when the normally westward-blowing trade winds weakened in late July and again in early September, sending them sliding eastward from the western Pacific toward the Americas. The Kelvin waves are 5 to 10 centimeters (2 to 4 inches) high, a few hundred kilometers wide and a few degrees warmer than surrounding waters. Traveling east at about 3 meters per second (6 miles per hour), they are expected to reach the coast of Peru in October.

Yet the present condition of this year's El Niño is dwarfed in comparison with the "macho" El Niño of 1997-1998, which brought devastating floods to California and severe drought to Indonesia, Australia and the Philippines. As seen in this September 20, 1997, image from the NASA/French Space Agency Topex/Poseidon satellite (see http://sealevel.jpl.nasa.gov/files/images/browse/entp2090.gif ), the size and intensity of the 1997-1998 event were much greater by this time of year. That leads some scientists, such as Bill Patzert, an oceanographer and climatologist at NASA's Jet Propulsion Laboratory, Pasadena, Calif., to express uncertainty as to whether this El Niño event will intensify enough to deliver the dramatic impacts seen during that last intense El Niño in 1997-1998.

"For the past few months, the trade winds have weakened somewhat, but whether the new Kelvin waves traveling eastward across the Pacific will be adequate to pump this El Niño up enough to reinvigorate it and deliver any real impacts remains uncertain," Patzert says.

Patzert notes that it is important to remember that not all El Niños are created equal. "Some El Niños are show stoppers, but most are mild to modest, with minimal to mixed impacts," he says. He notes that since 1998, there have been three mild to moderate El Niño's: in 2002-2003, 2004-2005 and 2006-2007.

None of these events delivered the heart-thumping impacts of the monster El Niño of 1997-1998. During the winter of 1997-1998, Southern California was soaked with nearly 79 centimeters (more than 31 inches) of rain (twice Los Angeles' normal annual rainfall amount of about 38.5 centimeters, or 15.14 inches). In addition, there was heavy snowpack in the Sierra Nevada and Rocky Mountains. In comparison, during the past four winters, Los Angeles has averaged only 24.6 centimeters (9.7 inches) of rain (64 percent of normal), and snowpacks have been stingy.

In fact, Patzert notes that this El Niño bears many similarities to the 2006-2007 El Niño event. During that winter, much of the American Southwest experienced record-breaking drought, and Los Angeles had its driest winter in recorded history.

So what will El Niño 2009-2010 hold in store for the world this coming winter? In spite of the uncertainties, experienced climate forecasters around the world will continue to monitor the Pacific closely for further signs of El Niño development and will give it their best shot.

"Unless present El Niño conditions intensify, I believe this El Niño is too weak to have a major influence on many weather patterns," he says. "A macho El Niño like that of 1997-1998 is off the board, but I'm hoping for a relaxation in the tropical trade winds and a surprise strengthening of El Niño that could result in a shift in winter storm patterns over the United States. If the trade winds decrease, the ocean waters will continue to warm and spread eastward, strengthening the El Niño. That scenario could bring atmospheric patterns that will deliver much-needed rainfall to the southwestern United States this winter. If not, the dice seem to be loaded for below-normal snowpacks and another drier-than-normal winter."

Still, Patzert remains hopeful. "Don't give up on this El Niño," he added. "He might make a late break and put his spin on this fall and winter's weather systems."

To learn more about Jason-1 and the Ocean Surface Topography Mission/Jason-2, visit: http://sealevel.jpl.nasa.gov .


NASA Ice Satellite Maps Profound Polar Thinning

Satellite data shows fast ice thinning (red) along the coast of West Antarctica
Researchers have used NASA’s Ice, Cloud and Land Elevation Satellite (ICESat) to compose the most comprehensive picture of changing glaciers along the coast of the Greenland and Antarctic ice sheets.

The new elevation maps show that all latitudes of the Greenland ice sheet are affected by dynamic thinning -- the loss of ice due to accelerated ice flow to the ocean. The maps also show surprising, extensive thinning in Antarctica, affecting the ice sheet far inland. The study, led by Hamish Pritchard of the British Antarctic Survey in Cambridge, England, was published September 24 in Nature.

ICESat’s precise laser altimetry instrument, launched in 2003, has provided a high-density web of elevation measurements repeated year after year across the Greenland and Antarctic ice sheets. With the dense coverage, the research team could distinguish which changes were caused by fast-flowing ice and which had other causes, such as melt.

The maps confirm that the profound ice sheet thinning of recent years stems from fast-flowing glaciers that empty into the sea. This was particularly the case in West Antarctica, where the Pine Island Glacier was found to be thinning between 2003 and 2007 by as much as 6 meters per year. In Greenland, fast-flowing glaciers were shown to thin by an average of nearly 0.9 meters per year.

From Nothing, Something: One Layer at a Time

Electron beam freeform fabrication process
A group of engineers working on a novel manufacturing technique at NASA's Langley Research Center in Hampton, Va., have come up with a new twist on the popular old saying about dreaming and doing: "If you can slice it, we can build it."

That's because layers mean everything to the environmentally-friendly construction process called Electron Beam Freeform Fabrication, or EBF3150, and its operation sounds like something straight out of science fiction.

"You start with a drawing of the part you want to build, you push a button, and out comes the part," said Karen Taminger, the technology lead for the Virginia-based research project that is part of NASA's Fundamental Aeronautics Program.

She admits that, on the surface, EBF3 reminds many people of a Star Trek replicator in which, for example, Captain Picard announces out loud, "Tea, Earl Grey, hot." Then there is a brief hum, a flash of light and the stimulating drink appears from a nook in the wall.

In reality, EBF3 works in a vacuum chamber, where an electron beam is focused on a constantly feeding source of metal, which is melted and then applied as called for by a drawing—one layer at a time—on top of a rotating surface until the part is complete.

While the options for using EBF3 are more limited than what science fiction allows, the potential for the process is no less out of this world, with promising relevance in aviation, spaceflight—even the medical community, Taminger said.

Commercial applications for EBF3 are already known and its potential already tested, Taminger said, noting it's possible that, within a few years, some aircraft will be flying with large structural parts made by this process.

To make EBF3 work there are two key requirements: A detailed three-dimensional drawing of the object to be created must be available, and the material the object is to be made from must be compatible for use with an electron beam.

First, the drawing is needed to break up the object into layers, with each cross-section used to guide the electron beam and source of metal in reproducing the object, building it up layer by layer.

"If you take a slice through a typical truss, you can see a couple of dots in each cross-section that move as you go from layer to layer," Taminger said. "When complete, you see those moving dots actually allowed you to build a diagonal brace into the truss."

Second, the material must be compatible with the electron beam so that it can be heated by the stream of energy and briefly turned into liquid form, making aluminum an ideal material to be used, along with other metals.

In fact, the EBF3 can handle two different sources of metal—also called feed stock—at the same time, either by mixing them together into a unique alloy or embedding one material inside another.

The potential use for the latter could include embedding a strand of fiber optic glass inside an aluminum part, enabling the placement of sensors in areas that were impossible before, Taminger said.

While the EBF3 equipment tested on the ground is fairly large and heavy, a smaller version was created and successfully test flown on a NASA jet that is used to provide researchers with brief periods of weightlessness. The next step is to fly a demonstration of the hardware on the International Space Station, Taminger said.

Future lunar base crews could use EBF3 to manufacture spare parts as needed, rather than rely on a supply of parts launched from Earth. Astronauts might be able to mine feed stock from the lunar soil, or even recycle used landing craft stages by melting them.

But the immediate and greatest potential for the process is in the aviation industry where major structural segments of an airliner, or casings for a jet engine, could be manufactured for about $1,000 per pound less than conventional means, Taminger said.

Environmental savings also are made possible by deploying EBF3, she added.

Normally an aircraft builder might start with a 6,000-pound block of titanium and machine it down to a 300-pound part, leaving 5,700 pounds of material that needs to be recycled and using several thousand gallons of cutting fluid used in the process..

"With EBF3 you can build up the same part using only 350 pounds of titanium and machine away just 50 pounds to get the part into its final configuration," Taminger said. "And the EBF3 process uses much less electricity to create the same part."

While initial parts for the aviation industry will be simple shapes, replacing parts already designed, future parts designed from scratch with the EBF3 process in mind could lead to improvements in jet engine efficiency, fuel burn rate and component lifetime.

"There's a lot of power in being able to build up your part layer by layer because you can get internal cavities and complexities that are not possible with machining from a solid block of material," Taminger said.

Shadow on the Moon

Shadow on the moon
Surveyor 1, the first of the Surveyor missions to make a successful soft landing, proved the validity of the spacecraft's design and landing technique. In addition to transmitting more than 11,000 pictures, Surveyor sent information on the bearing strength of the lunar soil, the radar reflectivity and temperature.

This image of Surveyor 1's shadow shows it against the lunar surface in the late lunar afternoon, with the horizon at the upper right. Surveyor 1 was launched on May 30, 1966, and landed on June 2, 1966.

NASA To Reveal New Scientific Findings About The Moon

Moon
NASA will hold a media briefing at 2 p.m. EDT on Thursday, Sept. 24, to discuss new science data from the moon collected during national and international space missions. NASA Television and the agency's Web site will provide live coverage of the briefing from the James E. Webb Memorial Auditorium at NASA Headquarters, 300 E St. SW, in Washington.

The briefing participants are:
- Jim Green, director, Planetary Science Division, Science Mission Directorate at NASA Headquarters in Washington
- Carle Pieters, principal investigator, Moon Mineralogy Mapper, Brown University
- Rob Green, project instrument scientist, Moon Mineralogy Mapper, NASA's Jet Propulsion Laboratory in Pasadena, Calif.
- Roger Clark, team member, Cassini spacecraft Visual and Infrared Mapping Spectrometer and co-investigator, Moon Mineralogy Mapper, U.S. Geological Survey in Denver
- Jessica Sunshine, deputy principal investigator for NASA’s Deep Impact extended mission and co-investigator for Moon Mineralogy Mapper, Department of Astronomy, University of Maryland

Reporters unable to attend the briefing may ask questions by telephone. To reserve a telephone line, journalists should e-mail their name.

Lump of Planetary Stuff

Lump of Planetary Stuff
This artist's conception shows a lump of material in a swirling, planet-forming disk. Astronomers using NASA's Spitzer Space Telescope found evidence that a companion to a star -- either another star or a planet -- could be pushing planetary material together, as illustrated here.

Planets are born out of spinning disks of gas and dust. They can carve out lanes or gaps in the disks as they grow bigger and bigger. Scientists used Spitzer's infrared vision to study the disk around a star called LRLL 31, located about 1,000 light-years away in the IC 348 region of the constellation Perseus. Spitzer's new infrared observations reveal that the disk has both an inner and outer gap.

What's more, the data show that infrared light from the disk is changing over as little time as one week -- a very unusual occurrence. In particular, light of different wavelengths seesawed back and forth, with short-wavelength light going up when long-wavelength light went down, and vice versa.

According to astronomers, this change could be caused by a companion to the star (illustrated as a planet in this picture). As the companion spins around, its gravity would cause the wall of the inner disk to squeeze into a lump. This lump would also spin around the star, shadowing part of the outer disk. When the bright side of the lump is on the far side of the star, and facing Earth, more infrared light at shorter wavelengths should be observed (hotter material closer to the star emits shorter wavelengths of infrared light). In addition, the shadow of the lump should cause longer-wavelength infrared light from the outer disk to decrease. The opposite would be true when the lump is in front of the star and its bright side is hidden (shorter-wavelength light would go down, and longer-wavelength light up). This is precisely what Spitzer observed.

The size of the lump and the planet have been exaggerated to better illustrate the dynamics of the system.

With an Eye on Locusts and Vegetation, Scientists Make a Good Tool Better


Locusts, the grasshopper-like insects of Biblical lore, are normally docile creatures that prefer solitary lives in the desert, away from other members of their species. But sometimes, when the rains come and patches of green begin to dot dry landscapes, their populations skyrocket and something extraordinary can happen. Hormonal changes, triggered by crowding, can cause the insects to change color, become more active and congregate in huge swarms capable of decimating crops.

In the 1980s, scientists at NASA's Goddard Space Flight Center and the United Nations' Food and Agriculture Organization (FAO) teamed up to develop a monitoring system that used satellite observations and other environmental data to monitor vegetation in the deserts of Africa, the Middle East and Asia for signs that swarms may be imminent. The Desert Locust Information Service (DLIS) used the satellite-derived Normalized Difference Vegetation Index (NDVI) -- based on the ratio of red and infrared radiation reflecting off the leaves of plants -- to detect where deserts were greening the most.

Compared to previous attempts to study vegetation from space, NDVI represented a vast improvement. Scientists could determine whether plant growth was significantly more or less productive than usual over a given time period -- just what they needed to predict whether locusts were likely to swarm. The advance gave officials precious time to target worrisome locust populations with pesticides before they could swarm and take their toll on crops.

Ironing Out the Wrinkles

Though state-of-the-art at the time, the system had a few shortcomings. For instance, bare soil in deserts can register an NDVI value similar to that of sparse vegetation. As a result, DLIS has occasionally issued false alarms, interpreting vegetation growth where there was none and missing the development of some real vegetation.

"If DLIS warns locust control teams of a risk and then it doesn't materialize, or if it misses places where vegetation and swarms may be developing, then officials could be less apt to mobilize the next time," said Pietro Ceccato, an associate research scientist at Columbia University, N.Y., who has also worked with the FAO on its locust monitoring system.

That system has evolved over the years, particularly since the arrival of the MODIS instruments on NASA's Terra and Aqua satellites, which offer a considerably better view than previous instruments. Since 2002, locust monitors at DLIS have supplemented NDVI with information from an additional channel -- the shortwave infrared -- to create composite images that better account for the differences between vegetation and bare soil.

While NDVI remains the most important tool available to monitor locusts from space, remote sensing specialists are hardly resting on their NDVI laurels. For instance, the Goddard group that helped create NDVI and FAO’s locust monitoring system continues to refine its ability to screen out extraneous data and increase image resolution.

Beyond Locusts

The impulse to refine NDVI isn't limited to locust studies. Small particles in the atmosphere (aerosols) and water vapor can make interpreting NDVI measurements difficult in some situations, explained Susan Ustin, a remote sensing expert at the University of California-Davis. Clouds, especially thin cirrus clouds, also can contaminate short-term measurements. And the color of soil can cause complications because vegetation over dark soils produces higher NDVI values than the same amount of vegetation over light soils.

As technology has advanced, scientists have attempted to overcome such problems by developing dozens of experimental indices, many of which are based upon NDVI. "It seems like a new index comes out every month," said Ustin. In fact, there are so many new indices being developed for such a variety of situations that's it's sometimes difficult for researchers to agree on which are worth pursuing.

Another problem with all the new indices, said Compton Tucker, a scientist at NASA Goddard who pioneered the use of NDVI, is that many are geared toward such specific ecosystems and environments that they aren't useful globally. There's a risk of creating niche products that won’t allow researchers to see the bigger, global picture.

"Most of the new indices will never make it out of the lab," said Steve Running, a vegetation scientist at the University of Montana and member of the Intergovernmental Panel on Climate Change. "But I think that we'll eventually come up with one or two alternatives that we can use to complement NDVI."

Engineers to Practice on Webb Telescope Simulator

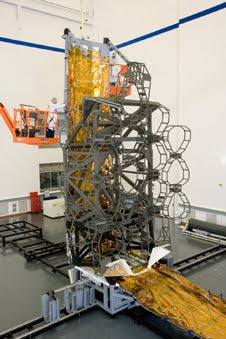
Webb telescope simulators
The huge assembly standing in Northrop Grumman Corporation’s high bay looks a lot like NASA's James Webb Space Telescope, but it’s a full-scale simulator of the space telescope’s key elements.

Engineers are using the simulator, consisting of the telescope’s primary backplane assembly and the sunshield’s integrated validation article, to develop the Webb Telescope’s hardware design. In addition, technicians are using it to gain experience handling large elements in advance of working with the actual hardware that will fly in space.

"Having a functioning demonstration article enables us to see how components, which were developed and tested individually, fit together as a whole system," said Martin Mohan, Webb Telescope program manager for Northrop Grumman Aerospace Systems sector. "The simulator is an effective risk reduction tool to help us validate design approaches early."

John E. Decker, Deputy Associate Director for the Webb Telescope at NASA's Goddard Space Flight Center said, "Simulators are important for the development of any spacecraft, and they are absolutely critical for one with the size and complexity of the Webb Telescope. We have already learned many important lessons from this simulator, and we expect to learn many more."

The simulator is a key element in the company’s extensive test and verification program, which relies on incremental verification, testing, and the use of crosschecks throughout the Webb Telescope’s development. The goal is to ensure that the final end-to-end Observatory test is a confirmation of the expected results. Northrop Grumman’s approach emulates its highly successful Chandra X-ray Observatory test and verification program.

Northrop has conducted a variety of tests with the simulator, including checking the clearances between sunshield membranes and the telescope to evaluating membrane management hardware and simulating the backplane support structure’s alignment measurements for future testing.

Northrop Grumman is the prime contractor for the Webb Telescope, leading a design and development team under contract to NASA’s Goddard Space Flight Center. Ball Aerospace & Technologies Corp. is the principal optical subcontractor to Northrop Grumman for the JWST program. ATK builds the telescope backplane and ITT develops the complex cryogenic metrology for optical testing.

The James Webb Space Telescope is the next-generation premier space observatory, exploring deep space phenomena from distant galaxies to nearby planets and stars. The Webb Telescope will give scientists clues about the formation of the universe and the evolution of our own solar system, from the first light after the Big Bang to the formation of star systems capable of supporting life on planets like Earth. It is expected to launch in 2014. The telescope is a joint project of NASA, the European Space Agency and the Canadian Space Agency.

New Vista of Milky Way Center Unveiled


A dramatic new vista of the center of the Milky Way galaxy from NASA's Chandra X-ray Observatory exposes new levels of the complexity and intrigue in the Galactic center. The mosaic of 88 Chandra pointings represents a freeze-frame of the spectacle of stellar evolution, from bright young stars to black holes, in a crowded, hostile environment dominated by a central, supermassive black hole.

Permeating the region is a diffuse haze of X-ray light from gas that has been heated to millions of degrees by winds from massive young stars -- which appear to form more frequently here than elsewhere in the Galaxy -- explosions of dying stars, and outflows powered by the supermassive black hole -- known as Sagittarius A* (Sgr A*). Data from Chandra and other X-ray telescopes suggest that giant X-ray flares from this black hole occurred about 50 and about 300 years earlier.

The area around Sgr A* also contains several mysterious X-ray filaments. Some of these likely represent huge magnetic structures interacting with streams of very energetic electrons produced by rapidly spinning neutron stars or perhaps by a gigantic analog of a solar flare.

Scattered throughout the region are thousands of point-like X-ray sources. These are produced by normal stars feeding material onto the compact, dense remains of stars that have reached the end of their evolutionary trail – white dwarfs, neutron stars and black holes.

Because X-rays penetrate the gas and dust that blocks optical light coming from the center of the galaxy, Chandra is a powerful tool for studying the Galactic Center. This image combines low energy X-rays (colored red), intermediate energy X-rays (green) and high energy X- rays (blue).

The image is being released at the beginning of the "Chandra's First Decade of Discovery" symposium being held in Boston, Mass. This four-day conference will celebrate the great science Chandra has uncovered in its first ten years of operations. To help commemorate this event, several of the astronauts who were onboard the Space Shuttle Columbia -- including Commander Eileen Collins -- that launched Chandra on July 23, 1999, will be in attendance.

NASA's Marshall Space Flight Center in Huntsville, Ala., manages the Chandra program for NASA's Science Mission Directorate in Washington. The Smithsonian Astrophysical Observatory controls Chandra's science and flight operations from Cambridge, Mass.

Radar Map of Buried Mars Layers Matches Climate Cycles

A Radar instrument on NASA's Mars Reconnaissance Orbiter for mapping underground ice-rich layers
New, three-dimensional imaging of Martian north-polar ice layers by a radar instrument on NASA's Mars Reconnaissance Orbiter is consistent with theoretical models of Martian climate swings during the past few million years.

Alignment of the layering patterns with the modeled climate cycles provides insight about how the layers accumulated. These ice-rich, layered deposits cover an area one-third larger than Texas and form a stack up to 2 kilometers (1.2 miles) thick atop a basal deposit with additional ice.

"Contrast in electrical properties between layers is what provides the reflectivity we observe with the radar," said Nathaniel Putzig of Southwest Research Institute, Boulder, Colo., a member of the science team for the Shallow Radar instrument on the orbiter. "The pattern of reflectivity tells us about the pattern of material variations within the layers."

Earlier radar observations indicated that the Martian north-polar layered deposits are mostly ice. Radar contrasts between different layers in the deposits are interpreted as differences in the concentration of rock material, in the form of dust, mixed with the ice. These deposits on Mars hold about one-third as much water as Earth's Greenland ice sheet.

Putzig and nine co-authors report findings from 358 radar observations in a paper accepted for publication by the journal Icarus and currently available online.

Their radar results provide a cross-sectional view of the north-polar layered deposits of Mars, showing that high-reflectivity zones, with multiple contrasting layers, alternate with more-homogeneous zones of lower reflectivity. Patterns of how these two types of zones alternate can be correlated to models of how changes in Mars' tilt on its axis have produced changes in the planet's climate in the past 4 million years or so, but only if some possibilities for how the layers form are ruled out.

"We're not doing the climate modeling here; we are comparing others' modeling results to what we observe with the radar, and using that comparison to constrain the possible explanations for how the layers form," Putzig said.

The most recent 300,000 years of Martian history are a period of less dramatic swings in the planet's tilt than during the preceding 600,000 years. Since the top zone of the north-polar layered deposits -- the most recently deposited portion -- is strongly radar-reflective, the researchers propose that such sections of high-contrast layering correspond to periods of relatively small swings in the planet's tilt.

They also propose a mechanism for how those contrasting layers would form. The observed pattern does not fit well with an earlier interpretation that the dustier layers in those zones are formed during high-tilt periods when sunshine on the polar region sublimates some of the top layer's ice and concentrates the dust left behind. Rather, it fits an alternative interpretation that the dustier layers are simply deposited during periods when the atmosphere is dustier.

The new radar mapping of the extent and depth of five stacked units in the north-polar layered deposits reveals that the geographical center of ice deposition probably shifted by 400 kilometers (250 miles) or more at least once during the past few million years.

"The radar has been giving us spectacular results," said Jeffrey Plaut of NASA's Jet Propulsion Laboratory, Pasadena, Calif., a co-author of the paper. "We have mapped continuous underground layers in three dimensions across a vast area."

The Italian Space Agency operates the Shallow Radar instrument, which it provided for NASA's Mars Reconnaissance Orbiter. The orbiter has been studying Mars with six advanced instruments since 2006. It has returned more data from the planet than all other past and current missions to Mars combined.

Robotic Lunar lander

Robotic Lunar lander
Marshall Space Flight Center is testing a new robotic lunar lander test bed that will aid in the development of a new generation of multi-use landers for robotic space exploration. The test article is equipped with thrusters that guide the lander, one set of which controls the vehicle's attitude that directs the altitude and landing. On the test lander, an additional thruster offsets the effect of Earth’s gravity so that the other thrusters can operate as they would in a lunar environment. MSFC is partnered with John Hopkins University Applied Physics Laboratory and the Von Braun Center for Science and Innovation for this project.

NASA Ramps Up for the STS-129 Mission

The external fuel tank for space shuttle Atlantis' STS-129
As space shuttle Discovery is checked out and processed following the STS-128 mission, NASA is preparing shuttle Atlantis for its next flight to the International Space Station.

The STS-129 mission will be commanded by Charlie Hobaugh and piloted by Barry Wilmore. Mission Specialists are Robert Satcher, Mike Foreman, Randy Bresnik and Leland Melvin. Wilmore, Satcher and Bresnik will be making their first trips to space.

Atlantis and its crew will deliver parts to the space station, including a spare gyroscope. The mission will feature three spacewalks.

Atlantis also will return station crew member Nicole Stott to Earth, as this is slated to be the final space shuttle crew rotation flight.

Atlantis

At NASA's Kennedy Space Center in Florida, technicians are preparing space shuttle Atlantis for its move from Orbiter Processing Facility-1 to the Vehicle Assembly Building, or VAB, next month.

Final preparations in the shuttle's aft section are complete and crews are working on the forward sections now. The main landing gear is set to be leak tested and the hydraulic fluid level will be checked today.

Battery installation and testing for the wing leading edge sensors is ongoing. The sensors help monitor the reinforced carbon carbon heat shield panels on the shuttle’s wings for possible debris impacts. The payload bay doors will be closed Friday for rollover.

Meanwhile in the VAB, Atlantis' external fuel tank and solid rocket boosters have been stacked on the mobile launcher platform in High Bay 2.

Measuring the Sun's Hidden Variability

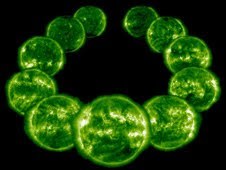
The extreme ultraviolet (EUV) sun imaged by the Solar and Heliospheric Observatory

Every 11 years, the sun undergoes a furious upheaval. Dark sunspots burst forth from beneath the sun's surface. Explosions as powerful as a billion atomic bombs spark intense flares of high-energy radiation. Clouds of gas big enough to swallow planets break away and billow into space. It's a flamboyant display of stellar power.

So why can't we see any of it?

Almost none of the drama of Solar Maximum is visible to the human eye. Look at the sun in the noontime sky and—ho-hum—it's the same old bland ball of light.

"The problem is, human eyes are tuned to the wrong wavelength," explains Tom Woods, a solar physicist at the University of Colorado in Boulder. "If you want to get a good look at solar activity, you need to look in the EUV."

EUV is short for "extreme ultraviolet," a high-energy form of ultraviolet radiation with wavelengths between 1 and 120 nanometers. EUV photons are much more energetic and dangerous than the ordinary UV rays that cause sunburns. Fortunately for humans, Earth's atmosphere blocks solar EUV; otherwise a day at the beach could be fatal.

When the sun is active, solar EUV emissions can rise and fall by factors of hundreds to thousands in just a matter of minutes. These surges heat Earth's upper atmosphere, puffing it up and increasing the air friction, or "drag," on satellites. EUV photons also break apart atoms and molecules, creating a layer of ions in the upper atmosphere that can severely disturb radio signals.

To monitor these energetic photons, NASA is going to launch a sensor named "EVE," short for EUV Variability Experiment, onboard the Solar Dynamics Observatory this winter.

"EVE gives us the highest time resolution and the highest spectral resolution that we've ever had for measuring the sun, and we'll have it 24/7," says Woods, the lead scientist for EVE. "This is a huge improvement over past missions."

Although EVE is designed to study solar activity, its first order of business is to study solar inactivity. SDO is going to launch during the deepest solar minimum in almost 100 years. Sunspots, flares and CMEs are at a low ebb. That's okay with Woods. He considers solar minimum just as interesting as solar maximum.

"Solar minimum is a quiet time when we can establish a baseline for evaluating long-term trends," he explains. "All stars are variable at some level, and the sun is no exception. We want to compare the sun's brightness now to its brightness during previous minima and ask: is the sun getting brighter or dimmer?"

The answer seems to be dimmer. Measurements by a variety of spacecraft indicate a 12-year lessening of the sun's "irradiance" by about 0.02% at visible wavelengths and 6% at EUV wavelengths. These results, which compare the solar minimum of 2008-09 to the previous minimum of 1996, are still very preliminary. EVE will improve confidence in the trend by pinning down the EUV spectrum with unprecedented accuracy.

The sun's variability and its potential for future changes are not fully understood—hence the need for EVE. "The EUV portion of the sun's spectrum is what changes most during a solar cycle," says Woods, "and that is the part of the spectrum we will be observing."

Woods gazes out his office window at the Colorado sun. It looks the same as usual. EVE, he knows, will have a different story to tell.

The Rim of Milichius A

The inner rim of Milichius A crater in Mare Insularum
This image shows part of the rim of crater Milichius A. Milichius A is a Copernican-aged crater (meaning it is less than 1.1 billion years old) in the middle of Mare Insularum. The "cracked" appearance of the rim exterior is a result of melted rock flowing out after impact. This outflow is fairly common among craters of similar size and age to Milichius A.

There are many different sizes of impact craters in this view. Only part of Milichius A, which is 9 km (5.6 miles) across, is shown. The smallest are just a few meters across. While there are numerous smaller craters surrounding Milichius A, its interior seems to have far fewer craters than the exterior area. Does this mean that there have been no impacts on the inner wall of Milichius A? Probably not; there have almost certainly been many small impacts on the steep surface. Instead, the streaks that you see on the crater walls are places where rocky debris has simply slumped into the crater, covering and obscuring the smaller craters as it slides down. Some of the darker streaks, however, may actually be impact melt flows.

The Lunar Reconnaissance Orbiter Camera was built by Malin Space Science Systems in San Diego, California, and is operated from the LROC Science Operations Center, part of the School of Earth and Space Exploration at Arizona State University in Tempe, Arizona.

Centaur is No Longer the Bridesmaid

Centaur upper stage into the Vertical Integration Facility
Centaur was the unnamed companion to the Atlas V rocket when it launched from Cape Canaveral, Fla., on June 18, 2009. Their mission: lift NASA's Lunar Reconnaissance Orbiter (LRO) into its lunar orbit. Piggybacking a ride on the Centaur was also the Lunar Crater Observation and Sensing Satellite (LCROSS) that will impact the moon in October. But something is different about this mission for Centaur: instead of quietly parking itself in a long-duration orbit of the earth, Centaur accompanied the two spacecraft on their journey toward the moon. What is more, Centaur will be the center of attention for a few glorious minutes this October.

The main LCROSS mission objective is to confirm the presence or absence of water ice in a permanently shadowed crater near a lunar polar region. Mission scientists have determined that the best way to do this is to send one or more objects into the surface of the moon to generate a large plume that can be studied to determine the presence of water ice. LCROSS is a small spacecraft, and besides not being able to make a major impact, its primary role is to observe a larger impact. That creates the opportunity for Centaur to take center stage.

LCROSS, still attached to its Centaur upper stage rocket, executed a fly-by of the moon on June 23, 2009 and entered into an elongated Earth orbit to position LCROSS for impact on a lunar pole. On final approach, the shepherding spacecraft and Centaur will separate. The Centaur will act as a heavy impactor to create a debris plume that will rise above the lunar surface. Projected impact at the lunar South Pole is currently: Oct 9, 2009 at 7:30 a.m. EDT. The Centaur will excavate a crater approximately 20 meters wide and almost 3 meters deep. More than 250 metric tons of lunar dust will be lofted above the surface of the moon.

Following four minutes behind, the shepherding spacecraft will fly through the debris plume, collecting and relaying data back to Earth before impacting the lunar surface and creating a second debris plume.

For almost 30 years, the NASA Glenn Research Center in Cleveland, Ohio, was responsible for the technical and cost and schedule management of the Centaur rocket. This program had an extraordinary operational success record. It was developed as an upper stage launch vehicle to be used with a first stage booster rocket, the Atlas rocket. Centaur's first mission objective was to send the unmanned Surveyor spacecraft to the Moon. Centaur has been used to boost satellites into orbit and propel probes into space. Mariner, Pioneer, Viking and Voyager spacecraft all got a boost from Centaur and provided invaluable data on these planets. Centaur also helped to revolutionize communication and expand the frontiers of space. In all, Glenn used Centaur for more than 100 unmanned launches. Centaur has quietly continued as the upper stage of the Atlas family of rockets from United Launch Alliance and the retired Titan IV from Lockheed Martin.

For each of its previous missions, Centaur quietly did its job and retreated out of the limelight. This time, Centaur is going out in style!

Discovery Towed to its Hangar

One of NASA's 747 Shuttle Carrier Aircraft touches down Monday at Kennedy Space Center in Florida
Space shuttle Discovery was hoisted off of the 747 Shuttle Carrier Aircraft that brought it from California and is inside Orbiter Processing Facility 3 at NASA's Kennedy Space Center in Florida. Technicians will begin servicing the shuttle from its just-completed STS-128 mission. The work includes removing the Leonardo supply module from Discovery's payload bay. The module carried new experiments and other equipment to the International Space Station and returned with some completed research items. The cargo bay also contains a depleted ammonia tank space walkers removed from the station, along with experiments that were mounted on the outside of the Columbus laboratory module.

Preparations are also under way in the Vehicle Assembly Building for the November launch of Atlantis on the STS-129 mission. The external tank for Atlantis was connected yesterday to the twin solid rocket boosters.

Google Earth Application Maps Carbon's Course

A Google Earth application reveals carbon dioxide in the lowest part of the atmosphere close to Earth's surface (green tracks) and carbon dioxide at higher altitudes that are immune from ground influences (red tracks).
Sometimes a picture really is worth a thousand words, particularly when the picture is used to illustrate science. Technology is giving us better pictures every day, and one of them is helping a NASA-funded scientist and her team to explain the behavior of a greenhouse gas.

Google Earth -- the digital globe on which computer users can fly around the planet and zoom in on key features -- is attracting attention in scientific communities and aiding public communication about carbon dioxide. Recently Google held a contest to present scientific results using KML, a data format used by Google Earth.

"I tried to think of a complex data set that would have public relevance," said Tyler Erickson, a geospatial researcher at the Michigan Tech Research Institute in Ann Arbor.

He chose to work with data from NASA-funded researcher Anna Michalak of the University of Michigan, Ann Arbor, who develops complex computer models to trace carbon dioxide back in time to where it enters and leaves the atmosphere.

"The datasets have three spatial dimensions and a temporal dimension," Erickson said. "Because the data is constantly changing in time makes it particularly difficult to visualize and analyze."

A better understanding of the carbon cycle has implications for energy and environmental policy and carbon management. In June 2009, Michalak described this research at the NASA Earth System Science at 20 symposium in Washington, D.C.

A snapshot from Erickson's Google Earth application shows green tracks representing carbon dioxide in the lowest part of the atmosphere close to Earth's surface where vegetation and land processes can impact the carbon cycle. Red tracks indicate particles at higher altitudes that are immune from ground influences.

The application is designed to educate the public and even scientists about how carbon dioxide emissions can be traced. A network of 1,000-foot towers across the United States is equipped with instruments by NOAA to measure the carbon dioxide content of parcels of air at single locations.

The application is designed to educate the public and even scientists about how carbon dioxide emissions can be traced. A network of 1,000-foot towers across the United States, like the tower above, are equipped with instruments by NOAA to measure the carbon dioxide content of parcels of air at single locations.

But where did that gas come from and how did it change along its journey? To find out, scientists rely on a sleuthing technique called "inverse modeling" – measuring gas concentrations at a single geographic point and then using clues from weather and atmospheric models to deduce where it came from. The technique is complex and difficult to explain even to fellow scientists.

Michalak related the technique to cream in a cup of coffee. "Say someone gave you a cup of creamy coffee," Michalak said. "How do you know when that cream was added?" Just as cream is not necessarily mixed perfectly, neither is the carbon dioxide in the atmosphere. If you can see the streaks of cream (carbon dioxide) and understand how the coffee (atmosphere) was stirred (weather), then scientists can use those clues to retrace the time and location that the ingredient was added to the mix.

The visual result typically used by scientists is a static two-dimensional map of the location of the gas, as averaged over the course of a month. Most carbon scientists know how to interpret the 2D map, but visualizing the 3D changes for non-specialists has proved elusive. Erickson spent 70 hours programming the Google Earth application that makes it easy to navigate though time and watch gas particles snake their way toward the NOAA observation towers. For his work, Erickson was declared one of Google's winners in March 2009.

"Having this visual tool allows us to better explain the scientific process," Michalak said. "It's a much more human way of looking at the science."

The next step, Erickson said, is to adapt the application to fit the needs of the research community. Scientists could use the program to better visualize the output of complex atmospheric models and then improve those models so that they better represent reality.

"Encouraging more people to deliver data in an interactive format is a good trend," Erickson said. "It should help innovation in research by reducing barriers to sharing data."

Cassini Reveals New Ring Quirks, Shadows During Saturn Equinox

Saturn
NASA scientists are marveling over the extent of ruffles and dust clouds revealed in the rings of Saturn during the planet's equinox last month. Scientists once thought the rings were almost completely flat, but new images reveal the heights of some newly discovered bumps in the rings are as high as the Rocky Mountains. NASA released the images Monday.

"It's like putting on 3-D glasses and seeing the third dimension for the first time," said Bob Pappalardo, Cassini project scientist at NASA's Jet Propulsion Laboratory in Pasadena, Calif. "This is among the most important events Cassini has shown us."

On Aug. 11, sunlight hit Saturn's rings exactly edge-on, performing a celestial magic trick that made them all but disappear. The spectacle occurs twice during each orbit Saturn makes around the sun, which takes approximately 10,759 Earth days, or about 29.7 Earth years. Earth experiences a similar equinox phenomenon twice a year; the autumnal equinox will occur Sept. 22, when the sun will shine directly over Earth's equator.

For about a week, scientists used the Cassini orbiter to look at puffy parts of Saturn's rings caught in white glare from the low-angle lighting. Scientists have known about vertical clumps sticking out of the rings in a handful of places, but they could not directly measure the height and breadth of the undulations and ridges until Saturn's equinox revealed their shadows.

"The biggest surprise was to see so many places of vertical relief above and below the otherwise paper-thin rings," said Linda Spilker, deputy project scientist at JPL. "To understand what we are seeing will take more time, but the images and data will help develop a more complete understanding of how old the rings might be and how they are evolving."

The chunks of ice that make up the main rings spread out 140,000 kilometers (85,000 miles) from the center of Saturn, but they had been thought to be only around 10 meters (30 feet) thick in the main rings, known as A, B, C, and D.

In the new images, particles seemed to pile up in vertical formations in each of the rings. Rippling corrugations -- previously seen by Cassini to extend approximately 804 kilometers (500 miles) in the innermost D ring -- appear to undulate out to a total of 17,000 kilometers (11,000 miles) through the neighboring C ring to the B ring.

The heights of some of the newly discovered bumps are comparable to the elevations of the Rocky Mountains. One ridge of icy ring particles, whipped up by the gravitational pull of Saturn's moon Daphnis as it travels through the plane of the rings, looms as high as about 4 kilometers (2.5 miles). It is the tallest vertical wall seen within the rings.

"We thought the plane of the rings was no taller than two stories of a modern-day building and instead we've come across walls more than 2 miles [3 kilometers] high," said Carolyn Porco, Cassini imaging team leader at the Space Science Institute in Boulder, Colo. "Isn't that the most outrageous thing you could imagine? It truly is like something out of science fiction."

Scientists also were intrigued by bright streaks in two different rings that appear to be clouds of dust kicked up in collisions between small space debris and ring particles. Understanding the rate and locations of impacts will help build better models of contamination and erosion in the rings and refine estimates of their age. The collision clouds were easier to see under the low-lighting conditions of equinox than under normal lighting conditions.

At the same time Cassini was snapping visible-light photographs of Saturn's rings, the Composite Infrared Spectrometer instrument was taking the rings' temperatures. During equinox, the rings cooled to the lowest temperature ever recorded. The A ring dropped down to a frosty 43 Kelvin (382 degrees below zero Fahrenheit). Studying ring temperatures at equinox will help scientists better understand the sizes and other characteristics of the ring particles.

The Cassini spacecraft has been observing Saturn, its moons and rings since it entered the planet's orbit in 2004. The spacecraft's instruments have discovered new rings and moons and have improved our understanding of Saturn's ring system.

The Cassini-Huygens mission is a cooperative project of NASA and the European and Italian Space Agencies. JPL manages the mission for the Science Mission Directorate at NASA Headquarters in Washington. JPL also designed, developed and assembled the Cassini orbiter and its two onboard cameras. The imaging team is based at the Space Science Institute. The Composite Infrared Spectrometer team is based at NASA's Goddard Space Flight Center in Greenbelt, Md.

To view Cassini images of the equinox and for more information about the mission, visit http://www.nasa.gov/cassini .

NASA Television's Video File also will air the images and interview sound bites. For downlink, scheduling information and streaming video, visit http://www.nasa.gov/ntv .

Highest GigaPan Panoramas Taken On Earth's Surface

GigaPan Imager taking a panorama at Camp II on Mt. Everest
On May 20, 2009, former NASA astronaut and Ames employee Scott Parazynski became the first person to have been to space and to climb to the summit of Mount Everest. On his way to the summit Parazynski was able to capture several photographic panoramas from record-setting heights.

An avid climber, Parazynski's main goal was to scale the majestic mountain. However, on his way up, Parazynski also captured two GigaPan panoramic images. He used a GigaPan Epic, a precision robotic camera mount that allows a series of finely coordinated high-resolution images to be taken of a large expanse of scenery. After the images were taken, special software stitched them together to form one dynamic panoramic image containing millions of pixels in breathtaking detail.

Keith Cowing was stationed at Everest Base Camp for a month so as to collect and relay Parazynski's progress to friends and followers. Cowing and Parazynski are both members of the Board of Directors of the Challenger Center for Space Science Education headquartered in Alexandria, Va.

GigaPan was developed by Carnegie Mellon University in collaboration with the NASA Ames Research Center's Intelligent Robotics Group, with support from Google, to create high-resolution panoramic images. GigaPan Systems was established in 2008 to bring this powerful, high-resolution imaging capability to a broad audience as a commercial spin-off.

In Search of Dark Asteroids

Wide-field Infrared Survey Explorer
Ninjas knew how to be stealthy: Be dark. Emit very little light. Move in the shadows between bright places.

In modern warfare, though, ninjas would be sitting ducks. Their black clothes may be hard to see at night with the naked eye, but their warm bodies would be clearly visible to a soldier wearing infrared goggles.

To hunt for the "ninjas" of the cosmos -- dim objects that lurk in the vast dark spaces between planets and stars -- scientists are building by far the most sensitive set of wide-angle infrared goggles ever, a space telescope called the Wide-field Infrared Survey Explorer, or WISE.

WISE will scan the entire sky at infrared wavelengths, creating the most comprehensive catalog yet of dark and dim objects in the cosmos: vast dust clouds, brown dwarf stars, asteroids -- even large, nearby asteroids that might pose a threat to Earth.

Surveys of nearby asteroids based on visible-light telescopes could be skewed toward asteroids with more-reflective surfaces. "If there's a significant population of asteroids nearby that are very dark, they will have been missed by these previous surveys," says Edward Wright, principal investigator for the mission and a physicist at UCLA.

The full-sky infrared map produced by WISE will reveal even these darker asteroids, mapping the locations and sizes of roughly 200,000 asteroids and giving scientists a clearer idea of how many large and potentially dangerous asteroids are nearby. WISE will also help answer questions about the formation of stars and the evolution and structure of galaxies, including our own Milky Way galaxy.

And the discoveries won't likely stop there.

"When you look at the sky with new sensitivity and a new wavelength band, like WISE is going to do, you're going to find new things that you didn't know were out there," Wright says.

Stars emit visible light in part because they're so hot. But cooler objects like asteroids emit light too, just at longer, infrared wavelengths that are invisible to the unaided eye. In fact, any object warmer than absolute zero will emit at least some infrared light.

Unfortunately, this fact makes building an infrared telescope rather difficult. Without a coolant, the telescope itself would glow in infrared light just like as other warm objects do. It would be like building a normal, visible-light telescope out of Times Square billboard lights: The telescope would be blinded by its own glow.

To solve this problem, WISE will cool its components to about 15 degrees Celsius above absolute zero (minus 258 degrees Celsius, or minus 433 degrees Fahrenheit) using a block of solid hydrogen. Mission scientists chose solid hydrogen over liquid helium, which is often used in research for cooling materials to near absolute zero, because a smaller volume of solid hydrogen can do the job. "The cooling power is much higher for hydrogen than for helium," Wright explains. When launching a telescope into space, being smaller and lighter saves money.

Previous space telescopes such as the Infrared Astronomical Satellite have mapped the sky at infrared wavelengths before, but WISE will be hundreds of times more sensitive. While other missions could only see diffuse sources of infrared light such as large dust clouds, WISE will be able to see asteroids and other point sources.

After it launches into orbit as early as this December, WISE will spend six months mapping the sky, during which it will download its data to ground stations four times each day. Analyzing that data should give scientists some new insights into the cosmos.

For example, one theory posits that most of the stars in the universe were formed in the press of colliding galaxies. When galaxies collide, interstellar clouds of gas and dust smash together, compressing the clouds and starting a self-perpetuating cycle of gravitational collapse. The result is a flurry of star birth. Newborn stars are usually concealed by the dusty clouds in which they are born. Ordinary light cannot escape, but infrared light can.

WISE will be able to detect infrared emissions from the most active star-forming regions. This will help scientists know how rapidly stars are formed during galactic collisions, which could indicate how many of the universe's stars were formed this way.

WISE will also target dim "failed stars" called brown dwarfs that outnumber ordinary stars by a wide margin. Mapping brown dwarfs in the Milky Way may reveal much about the structure and evolution of our own galaxy.

And this could be just the beginning of the discoveries scientists make once WISE puts the spotlight on stealthy denizens of the dark.